PCOS Detection Using Machine Learning
Building a Polycystic Ovary Syndrome (PCOS) detection model using Machine Learning

I'm a Machine Learning Engineer passionate about building production-ready ML systems for the African market. With experience in TensorFlow, Keras, and Python-based workflows, I help teams bridge the gap between machine learning research and real-world deployment—especially on resource-constrained devices. I'm also a Google Developer Expert in AI. I regularly speak at tech conferences including PyCon Africa, DevFest Kampala, DevFest Nairobi and more and also write technical articles on AI/ML here.
Introduction
Polycystic Ovary Syndrome (PCOS) is a common hormonal disorder that affects many women of reproductive age. It is characterized by the presence of multiple cysts in the ovaries, irregular menstrual cycles, and symptoms such as excessive hair growth, acne, and weight gain.
Early detection of PCOS is crucial for effective management and treatment of the condition. Machine Learning (ML) techniques can be utilized to build predictive models that can aid in the detection and diagnosis of PCOS. In this article, we will explore the process of PCOS detection using ML and provide code snippets for implementation.
Understanding PCOS Detection
PCOS detection involves analyzing various factors such as medical history, symptoms, physical examinations, and laboratory tests. ML algorithms can learn patterns and relationships within these factors to predict the likelihood of PCOS. We will use Python and the scikit-learn library, which provides a wide range of ML algorithms and utilities.
Import the Required Libraries
We will need to import essential libraries like Pandas, scikit-learn, and Seaborn, NumPy for numerical computations, and Matplotlib for visualizing the results. Create a new Python script, and import the necessary libraries as shown below:
import pandas as pd
import numpy as np
import matplotlib.pyplot as plt
%matplotlib inline
import seaborn as sns
from sklearn.model_selection import train_test_split
from sklearn.preprocessing import StandardScaler
from sklearn.ensemble import RandomForestClassifier
from sklearn.svm import SVC
from sklearn.metrics import accuracy_score, precision_score, recall_score, f1_score
Data Collection
Gather a dataset that includes relevant features and labels. The features can include medical history, symptoms, hormone levels, and other related variables, while the labels indicate whether an individual has been diagnosed with PCOS or not.
Below is the dataset that we are going to use in this article:
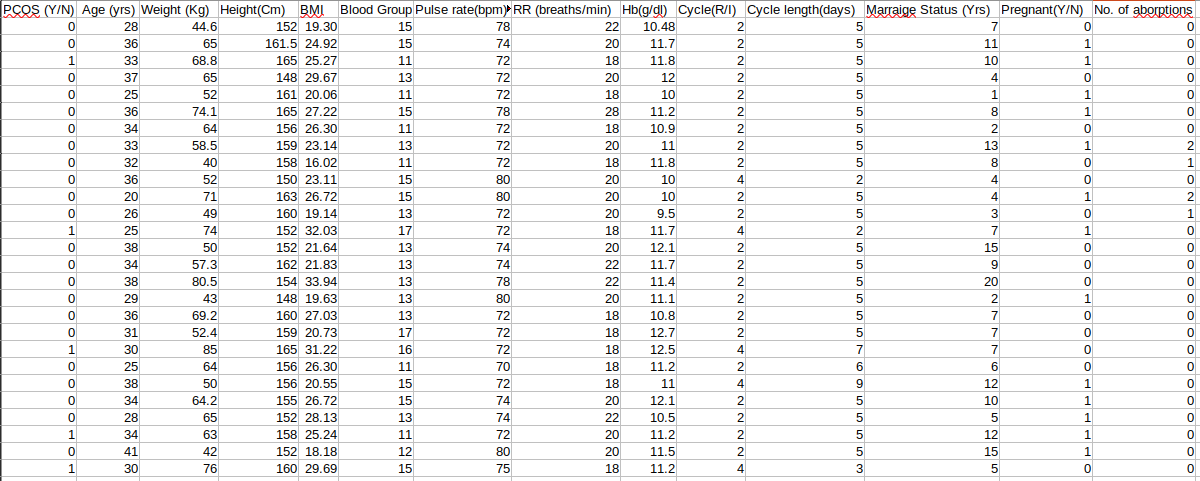
Load the dataset in a Google Colab or Jupyter Notebook environment
# Load the dataset
pcosData = pd.read_csv('pcos_dataset.csv')
Data Preprocessing
Clean the dataset by handling missing values, normalizing numerical features, and encoding categorical variables.
# Check for the sum of null values in each column
pcosData.isnull().sum()
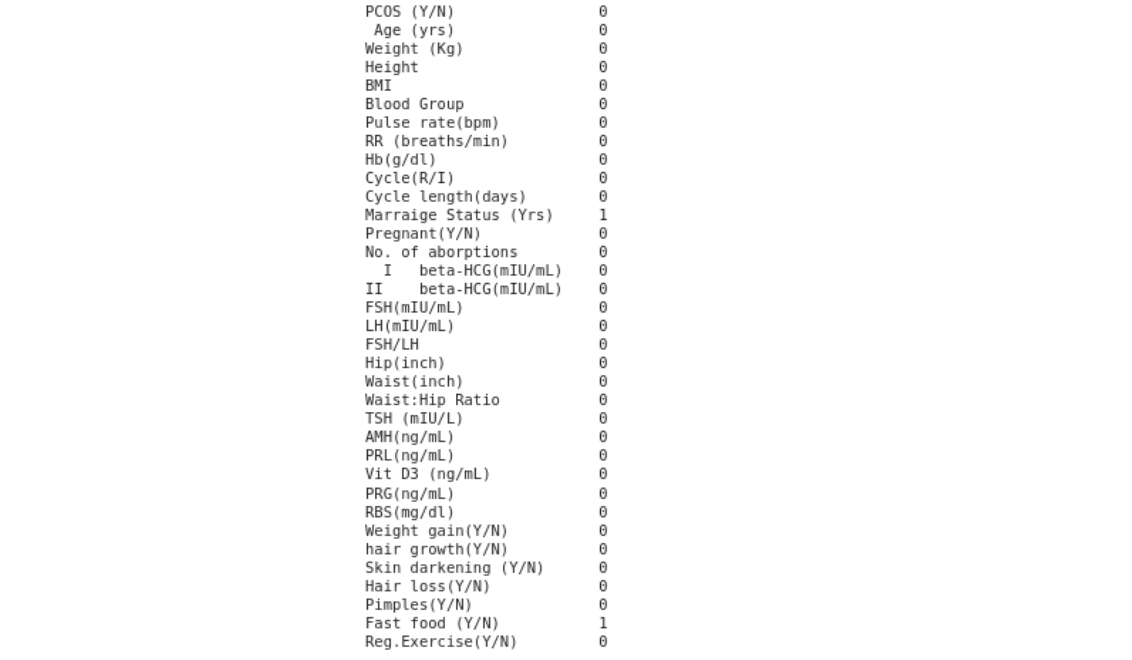
You will realize that Marriage Status and Fast Food both have a null value that need to be cleaned (dropped).
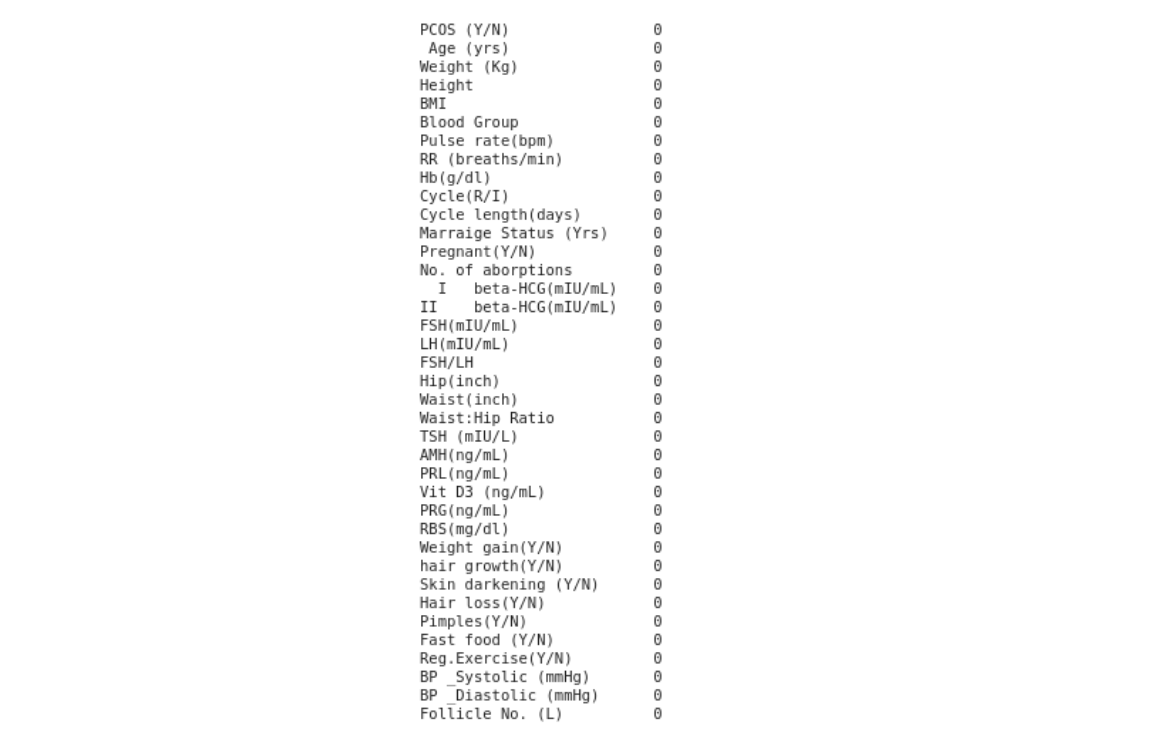
# Drop all the null values in the dataset
pcosData = pcosData.dropna()
# Check again for the sum of null values in each column
pcosData.isnull().sum()
Depending on the dataset that you have, sometimes the data type of the data collected could be object instead of int64 or float64. It is our duty to typecast the data to the right data type for numerical computation and manipulation. The code snippet ensures that we cast the data to numerical values.
for column in pcosData:
    columnSeriesObj = pcosData[column]
    pcosData[column] = pd.to_numeric(pcosData[column], errors='coerce')
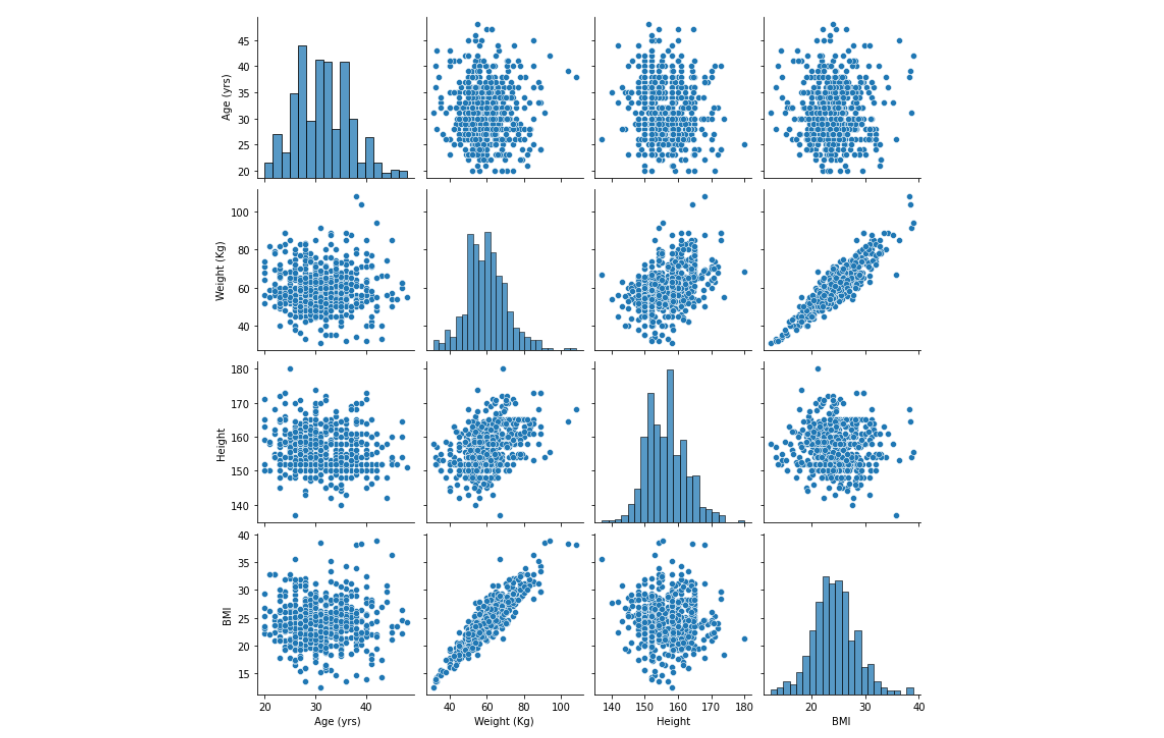
We can now visualize our data using Seaborn's pairplot function. The pairplot function creates a grid of scatterplots and histograms to visualize the pairwise relationships between multiple variables in a dataset. It provides a quick way to explore the correlation and distribution of variables.
In our case, we are going to visualize the pairwise relationship between the Age, Weight, Height and BMI of the patients to find any correlation between these features.
sns.pairplot(pcosData.iloc[:,1:5])
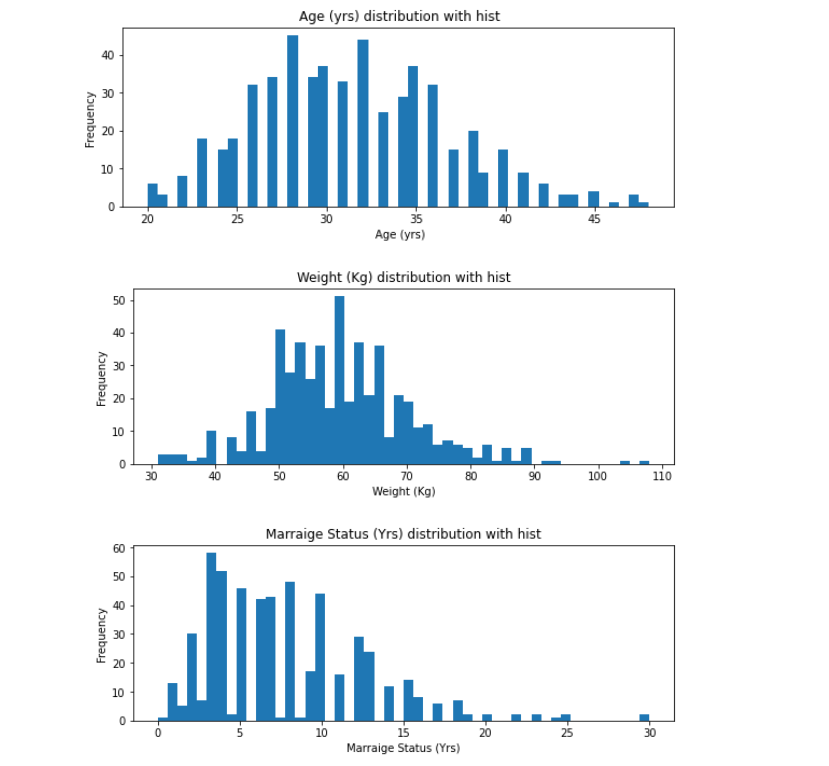
To get more insights into the data we are looking at, we shall plot histograms showing the distribution of Age, Weight and Marital Status among the patients.
def plot_hist(variable):
    plt.figure(figsize = (9,3))
    plt.hist(pcosData[variable], bins = 50)
    plt.xlabel(variable)
    plt.ylabel("Frequency")
    plt.title("{} distribution with hist".format(variable))
    plt.show()

numericVar = [" Age (yrs)", "Weight (Kg)","Marraige Status (Yrs)"]
for n in numericVar:
    plot_hist(n)
Lastly, we shall plot a correlation graph between the features in that dataset. This is important when choosing which features to use when predicting PCOS in patients. As an ML engineer, you need to choose optimal features that will give you the best accuracy in prediction, not just 99%.
corr_matrix = pcosData.corr()
plt.subplots(figsize=(30,10))
sns.heatmap(corr_matrix, annot = True, fmt = ".2f");
plt.title("Correlation Between Features")
plt.show()

Split the dataset into features and labels X and Y and then split the dataset into training and testing sets.
# Split the dataset into features and labels
X = pcosData.iloc[:,1:41].values
y = pcosData.iloc[:,0].values

# Split the dataset into training and testing sets
X_train, X_test, y_train, y_test = train_test_split(X, y, test_size = 0.3, random_state = 42)
Feature Selection
Analyze the dataset to identify the most informative features. This step helps improve model performance and reduces computational complexity. Techniques such as correlation analysis, feature importance ranking, and domain expertise can aid in feature selection.
# Normalize the numerical features
sc = StandardScaler()
X_train = sc.fit_transform(X_train)
X_test = sc.fit_transform(X_test)
Model Selection
Choose an appropriate ML algorithm for PCOS detection. Commonly used algorithms include Logistic Regression, Support Vector Machines (SVM), Random Forest, and Gradient Boosting. Consider the characteristics of the dataset, such as the number of features and the size of the dataset, to make an informed choice. In our case, we are going to use Support Vector Machine (SVM) and Random Forest.
# Create a Random Forest model
rf_model = RandomForestClassifier()

# Create an SVM model
svm_model = SVC()
Model Training
Train the selected ML model using the training dataset. During training, the model learns the patterns and relationships between the features and labels. This step involves optimization techniques to find the best set of model parameters.
# Train the Random Forest model
rf_model.fit(X_train, y_train)

# Train the SVM model
svm_model.fit(X_train, y_train)
Make Predictions
Once the model is trained and evaluated, it can be used to make predictions on new, unseen data. The model takes in input features related to a specific individual and predicts the probability of that individual having PCOS.
# Make predictions on the testing set with RF
rf_pred = rf_model.predict(X_test)

# Make predictions on the testing set with SVM
svm_pred = svm_model.predict(X_test)
Model Evaluation
Evaluate the trained model using the testing dataset. Performance metrics such as accuracy, precision, recall, and F1 score can be used to assess the model's performance. Adjust the model's hyperparameters if necessary to improve performance.
# Evaluate the Random Forest model
rf_accuracy = accuracy_score(y_test, rf_pred)
rf_precision = precision_score(y_test, rf_pred)
rf_recall = recall_score(y_test, rf_pred)
rf_f1 = f1_score(y_test, rf_pred)

print("Random Forest Accuracy:", rf_accuracy)
print("Random Forest Precision:", rf_precision)
print("Random Forest Recall:", rf_recall)
print("Random Forest F1 Score:", rf_f1)

# Evaluate the SVM model
svm_accuracy = accuracy_score(y_test, svm_pred)
svm_precision = precision_score(y_test, svm_pred)
svm_recall = recall_score(y_test, svm_pred)
svm_f1 = f1_score(y_test, svm_pred)

print("SVM Accuracy:", svm_accuracy)
print("SVM Precision:", svm_precision)
print("SVM Recall:", svm_recall)
print("SVM F1 Score:", svm_f1)
Model Deployment
After successfully training and evaluating the model, we can deploy it to make PCOS diagnoses on new, unseen data. This could involve integrating the model into a web application, mobile app, or any other suitable platform.
# Save the trained RF model
rf_model.save('pcos_rf_model.h5')

# Save the trained SVM model
svm_model.save('pcos_svm_model.h5')
Conclusion
Machine Learning techniques provide a valuable tool for the detection and diagnosis of Polycystic Ovary Syndrome (PCOS). By leveraging ML algorithms, we can analyze various factors and build predictive models that assist healthcare professionals in identifying PCOS in patients. This article outlined the step-by-step process of PCOS detection using ML and provided code snippets for data preprocessing, model training, and evaluation. Remember to adapt the code to your specific dataset and explore different ML algorithms to find the best approach for PCOS detection.
Resources
Access the code snippets in a Google Colab notebook here (MIT License).
Access the dataset used in this article here (MIT License). Don't request access, Make A Copy.